The Numbers
Carbon dioxide levels in the atmosphere are 50% higher than pre-industrial levels (NOAA, 2022). 2025 finished as the third warmest year on record for the globe. From 1980 to August 2024, the U.S. alone has experienced 396 weather and climate disasters - the total cost of these events to the economy is estimated at $2.780 trillion (NOAA, 2026).
Without an awareness of basic climate statistics and projections, your decisions for your future are not well informed.
This page aims to give you a grasp of these numbers, regardless of your background in climate science or education as a whole. If you have unanswered questions after reading this material, fill out the contact form at the bottom of the page. Thank you for your engagement.
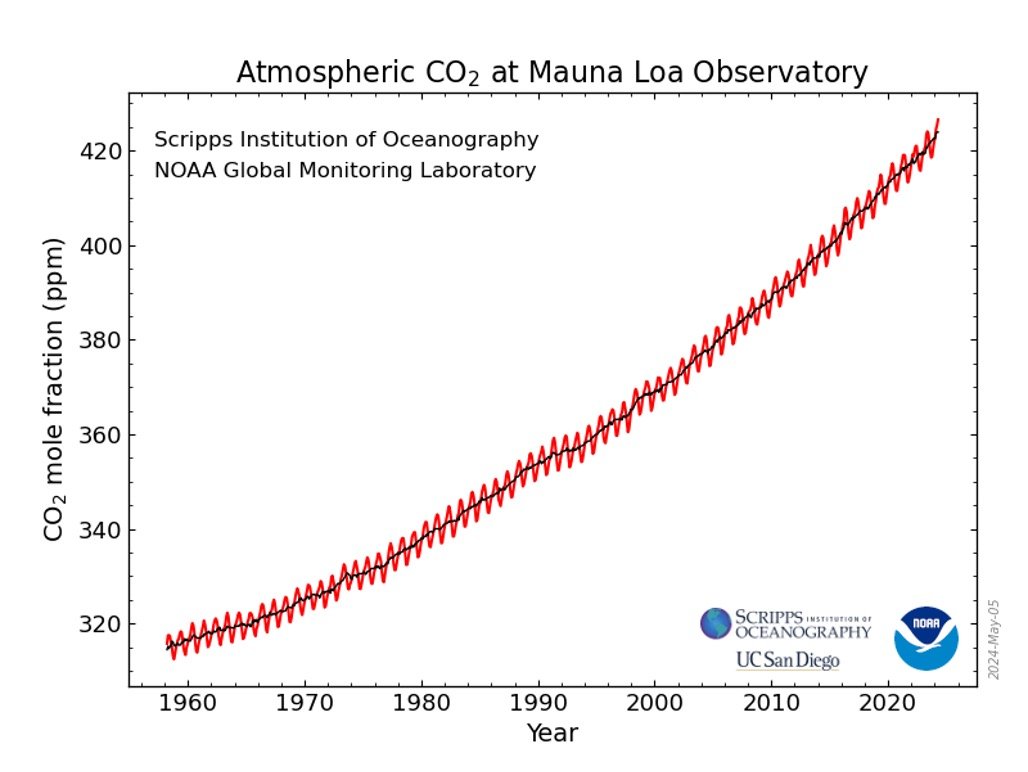
This graph shows you the monthly mean of carbon dioxide in the atmosphere, collected by researchers at Mauna Loa Observatory in Hawaii. This trend is mirrored by graphs representing global monthly means of CO2 levels. Clearly, the above levels are rising - but I want you to notice that they are not rising in the form of an exponentially devastating trend. Rather, this relatively linear trend should tell you that for every emission to the atmosphere, there is a proportional atmospheric effect. Therefore, every individual action matters. While you might assume individual climate responsibility pales in comparison to the actions of big fossil fuel emitters and the grid, and in many respects it does, this graph should communicate to you that your daily decisions do have an effect.
So now that we’ve debunked the myth that your daily actions have no impact, let’s get into the weeds with more global emissions, projections, and problems.
Learn the Basics: Climate Science, Risk & Solutions
Explore this public online resource from Dr. Kerry Emanuel, a professor of Atmospheric Science at MIT. Here you can find the beautiful basics of climate science, along with the challenges of climate change, its associated risks, and creative solutions.